When to go to Guadeloupe?

Guadeloupe has a tropical climate. To best enjoy Guadeloupe’s beautiful beaches, visit during the dry season from December to April when temperatures are between 22°C and 30°C.
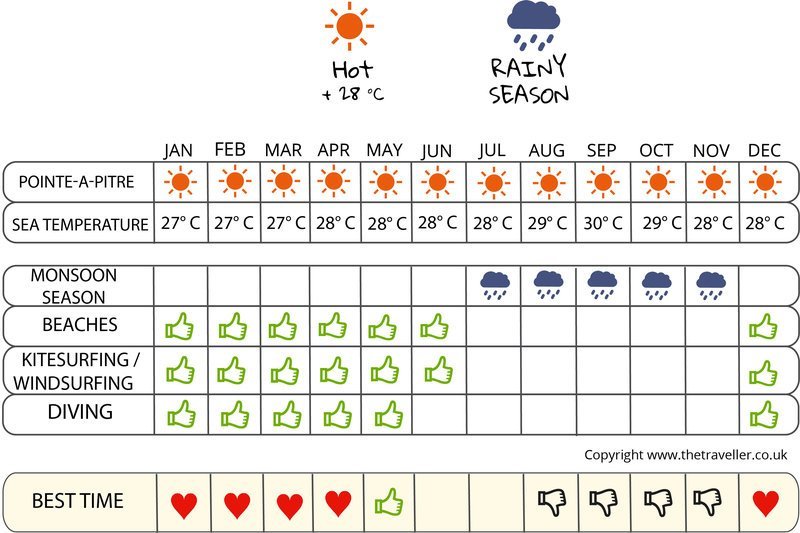
Guadeloupe enjoys a tropical climate marked by "Carême" (the dry season) and the wet season, known as “hivernage” from June to November. During the dry season, the average temperature is around 27°C, almost identical to that during the wet season with high levels of sunshine. Some showers may fall but they are very short-lived. During the wet season, rain is much more frequent and the atmosphere warm and humid. October is the wettest month. Avoid the wet season and its hurricanes if you can. Sea temperatures are good on the many beaches, with water between 26°C and 28°C throughout the year.
For your trip to Guadeloupe , we recommend visiting during the dry season from December to April. You will be able to make the most of the magnificent beaches and the hiking around Basse-Terre.
It is also an opportunity occasion to participate in traditional activities, meet the locals and discover Antillean culture.
What to do in Guadeloupe?
December is a very festive period, a time of tradition and sharing to celebrate the end of the year. You will see a different side to the island as well discover the famous schrubb (liqueur) and its spicy cuisine.
Throughout the month of December, festivities in the neighbourhoods are organised by local musicians, and Christmas carols are sung in a welcoming environment.
Carnival takes place from January 1st and extends over the month. This is the ideal time to discover the island’s active cultural heritage. Guadeloupe’s carnival is one of the most beautiful in the world thanks to the costumes and folklore of this event.
Discover different recipes for the island’s revered crustacean at the crab festival, which usually takes place during the Easter holidays in Morne à l’eau.
Kid goats are celebrated during the “Désirade,” an alternative to the Easter celebrations.
In April, Karujet the international jet ski championships, descend on Viard Petit Bourg beach.
Between the months of May and June, the International “Terre de Blues” music festival is held in Grand Bourg de Marie Galante.
In August, one regional event is not to be missed: Cook's Day features parades, tastings and a ceremonies in honour of kitchen matriarchs.
Every 4th November, the Route du Rhum yacht race selects Guadeloupe as its final destination.
|
Temperatures Pointe-à-Pitre
| Jan | Feb | March | April | May | June | Jul | August | Sept | Oct | nov. | dec. | |
|---|---|---|---|---|---|---|---|---|---|---|---|---|
| Min temperature | 20° | 20° | 21° | 22° | 23° | 24° | 24° | 24° | 24° | 23° | 22° | 21° |
| Max temperature | 30° | 30° | 30° | 31° | 31° | 32° | 32° | 32° | 32° | 32° | 31° | 30° |
| Sea temperature | 27° | 27° | 27° | 27° | 28° | 29° | 29° | 29° | 29° | 29° | 29° | 28° |
Sunshine
Rainfall Pointe-à-Pitre

The weather month by month in Guadeloupe
Weather Pointe-à-Pitre in January
Sea: 27 °
| 14 d/month | 12 d/month | 5 d/month |
In January, in Pointe-à-Pitre, Minimum temperatures vary between 20 in the morning and 30 in the afternoon. The average rainfall is around 86 inches, for 17 days without rain.
Check the weather over the last 5 years for the dates of your stay
Weather history day by day
Weather Pointe-à-Pitre in February
Sea: 27 °
| 13 d/month | 12 d/month | 3 d/month |
In February, in Pointe-à-Pitre, Minimum temperatures vary between 20 in the morning and 30 in the afternoon. The average rainfall is around 55 inches, for 19 days without rain.
Check the weather over the last 5 years for the dates of your stay
Weather history day by day
Weather Pointe-à-Pitre in March
Sea: 27 °
| 15 d/month | 13 d/month | 3 d/month |
In March, in Pointe-à-Pitre, Minimum temperatures vary between 21 in the morning and 30 in the afternoon. The average rainfall is around 66 inches, for 18 days without rain.
Check the weather over the last 5 years for the dates of your stay
Weather history day by day
Weather Pointe-à-Pitre in April
Sea: 27 °
| 13 d/month | 11 d/month | 4 d/month | 2 d/month |
In April, in Pointe-à-Pitre, Minimum temperatures vary between 22 in the morning and 31 in the afternoon. Températures are really hot. The average rainfall is around 82 inches, for 16 days without rain.
Check the weather over the last 5 years for the dates of your stay
Weather history day by day
Weather Pointe-à-Pitre in May
Sea: 28 °
| 15 d/month | 9 d/month | 4 d/month | 3 d/month |
In May, in Pointe-à-Pitre, Minimum temperatures vary between 23 in the morning and 31 in the afternoon. Températures are really hot. The average rainfall is around 109 inches, for 13 days without rain.
Check the weather over the last 5 years for the dates of your stay
Weather history day by day
Weather Pointe-à-Pitre in June
Sea: 29 °
| 13 d/month | 8 d/month | 7 d/month | 1 day | 1 day |
In June, in Pointe-à-Pitre, Minimum temperatures vary between 24 in the morning and 32 in the afternoon. Températures are really hot. The average rainfall is around 101 inches, for 17 days without rain.
Check the weather over the last 5 years for the dates of your stay
Weather history day by day
Weather Pointe-à-Pitre in July
Sea: 29 °
| 15 d/month | 8 d/month | 5 d/month | 2 d/month | 1 day |
In July, in Pointe-à-Pitre, Minimum temperatures vary between 24 in the morning and 32 in the afternoon. Températures are really hot. The average rainfall is around 110 inches, for 14 days without rain.
Check the weather over the last 5 years for the dates of your stay
Weather history day by day
Weather Pointe-à-Pitre in August
Sea: 29 °
| 13 d/month | 9 d/month | 5 d/month | 4 d/month |
In August, in Pointe-à-Pitre, Minimum temperatures vary between 24 in the morning and 32 in the afternoon. Températures are really hot. The average rainfall is around 149 inches, for 14 days without rain.
Check the weather over the last 5 years for the dates of your stay
Weather history day by day
Weather Pointe-à-Pitre in September
Sea: 29 °
| 10 d/month | 10 d/month | 6 d/month | 3 d/month | 1 day |
In September, in Pointe-à-Pitre, Minimum temperatures vary between 24 in the morning and 32 in the afternoon. Températures are really hot. The average rainfall is around 194 inches, for 15 days without rain.
Check the weather over the last 5 years for the dates of your stay
Weather history day by day
Weather Pointe-à-Pitre in October
Sea: 29 °
| 12 d/month | 9 d/month | 6 d/month | 3 d/month | 1 day |
In October, in Pointe-à-Pitre, Minimum temperatures vary between 23 in the morning and 32 in the afternoon. Températures are really hot. The average rainfall is around 213 inches, for 16 days without rain.
Check the weather over the last 5 years for the dates of your stay
Weather history day by day
Weather Pointe-à-Pitre in November
Sea: 29 °
| 15 d/month | 7 d/month | 5 d/month | 2 d/month | 1 day |
In November, in Pointe-à-Pitre, Minimum temperatures vary between 22 in the morning and 31 in the afternoon. Températures are really hot. The average rainfall is around 186 inches, for 14 days without rain.
Check the weather over the last 5 years for the dates of your stay
Weather history day by day
Weather Pointe-à-Pitre in December
Sea: 28 °
| 19 d/month | 6 d/month | 5 d/month | 1 day |
In December, in Pointe-à-Pitre, Minimum temperatures vary between 21 in the morning and 30 in the afternoon. The average rainfall is around 141 inches, for 11 days without rain.
Check the weather over the last 5 years for the dates of your stay
Weather history day by day
Influx of tourists
Temperature and climate in:
Capesterre-Belle-Eau | Deshaies | Les Saintes | Pointe-à-Pitre | Saint-Claude | Saint-François | Sainte-Anne |