When to go to Sardinia?
Sardinia has an essentially Mediterranean climate. There are 4 seasons: spring, summer, autumn and winter. In summer, from June to September, temperatures range from 25°C to 30°C. In spring, (March, April and May) and autumn (October and November) temperatures are between 15°C and 20°C. And in winter, (December, January and February), between 10°C and 15°C on average. The months of lowest rainfall are July and August, but generally it rains very little in Sardinia.
Sardinia has two climate zones: Mediterranean to arid on the mountainous, rough coast around Nuoro and Barbagia. The wind reminds us that Sardinia is subject to several meteorological phenomena: The sirocco from the Tunisian and Algerian deserts, the ponente from Spain, and the mistral from Corsica and Italy. In spring, the maquis exudes its perfume, when orange, almond and quince trees are in bloom. In the autumn, the water is still warm and the climate is perfectly comfortable; in July and August, the influx of tourists rises with the temperature.
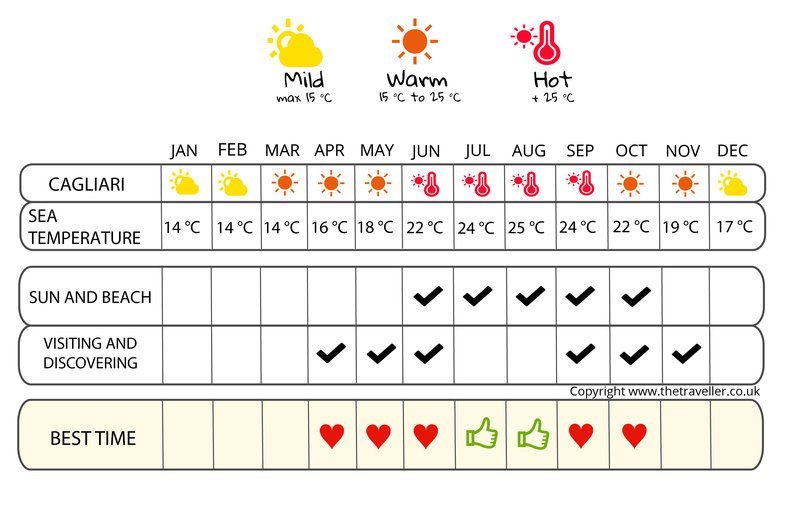
We recommend June> to visit Sardinia. It is already nice and warm and prices are still quite low. Don’t wait any longer to book your trip toSardinia!
|
Temperatures Cagliari
| Jan | Feb | March | April | May | June | Jul | August | Sept | Oct | nov. | dec. | |
|---|---|---|---|---|---|---|---|---|---|---|---|---|
| Min temperature | 5° | 5° | 7° | 9° | 13° | 17° | 20° | 21° | 18° | 15° | 10° | 7° |
| Max temperature | 15° | 15° | 18° | 20° | 24° | 28° | 31° | 32° | 28° | 24° | 19° | 15° |
| Sea temperature | 14° | 14° | 14° | 16° | 18° | 22° | 24° | 25° | 24° | 22° | 19° | 17° |
Sunshine
Rainfall Cagliari

The weather month by month in Sardinia
Weather Cagliari in January
Sea: 14 °
| 14 d/month | 6 d/month | 5 d/month | 3 d/month | 2 d/month | 1 day |
In January, in Cagliari, temperatures range from 5 to 15 degrees. Temperatures are low but with a lot of sunshine. The average rainfall is around 36 inches, for 23 days without rain.
Check the weather over the last 5 years for the dates of your stay
Weather history day by day
Weather Cagliari in February
Sea: 14 °
| 11 d/month | 7 d/month | 6 d/month | 2 d/month | 1 day | 1 day |
In February, in Cagliari, temperatures range from 5 to 15 degrees. Temperatures are low but with a lot of sunshine. The average rainfall is around 35 inches, for 24 days without rain.
Check the weather over the last 5 years for the dates of your stay
Weather history day by day
Weather Cagliari in March
Sea: 14 °
| 15 d/month | 6 d/month | 6 d/month | 2 d/month | 1 day | 1 day |
In March, in Cagliari, temperatures range from 7 to 18 degrees. The average rainfall is around 27 inches, 23 days without rain in March
Check the weather over the last 5 years for the dates of your stay
Weather history day by day
Weather Cagliari in April
Sea: 16 °
| 17 d/month | 5 d/month | 4 d/month | 2 d/month | 2 d/month |
In April, in Cagliari, temperatures range from 9 to 20 degrees. The weather is sunny and Pleasant. Rainfall in April: 47 inches, for about 25 days without rain.
Check the weather over the last 5 years for the dates of your stay
Weather history day by day
Weather Cagliari in May
Sea: 18 °
| 20 d/month | 5 d/month | 3 d/month | 2 d/month | 1 day |
In May, in Cagliari, Minimum temperatures vary between 13 in the morning and 24 in the afternoon. The average rainfall is around 22 inches, for 26 days without rain.
Check the weather over the last 5 years for the dates of your stay
Weather history day by day
Weather Cagliari in June
Sea: 22 °
| 26 d/month | 2 d/month | 2 d/month |
In June, in Cagliari, Minimum temperatures vary between 17 in the morning and 28 in the afternoon. Temperatures are hot. The average rainfall is around 35 inches, for 29 days without rain.
Check the weather over the last 5 years for the dates of your stay
Weather history day by day
Weather Cagliari in July
Sea: 24 °
| 28 d/month | 2 d/month | 1 day |
In July, in Cagliari, Minimum temperatures vary between 20 in the morning and 31 in the afternoon. Températures are really hot. The average rainfall is around 3 inches, for 30 days without rain.
Check the weather over the last 5 years for the dates of your stay
Weather history day by day
Weather Cagliari in August
Sea: 25 °
| 29 d/month | 1 day | 1 day |
In August, in Cagliari, Minimum temperatures vary between 21 in the morning and 32 in the afternoon. Températures are really hot. The average rainfall is around 7 inches, for 30 days without rain.
Check the weather over the last 5 years for the dates of your stay
Weather history day by day
Weather Cagliari in September
Sea: 24 °
| 21 d/month | 4 d/month | 3 d/month | 1 day | 1 day |
In September, in Cagliari, Minimum temperatures vary between 18 in the morning and 28 in the afternoon. Temperatures are hot. The average rainfall is around 65 inches, for 27 days without rain.
Check the weather over the last 5 years for the dates of your stay
Weather history day by day
Weather Cagliari in October
Sea: 22 °
| 21 d/month | 4 d/month | 3 d/month | 2 d/month | 1 day |
In October, in Cagliari, Minimum temperatures vary between 15 in the morning and 24 in the afternoon. The average rainfall is around 60 inches, for 26 days without rain.
Check the weather over the last 5 years for the dates of your stay
Weather history day by day
Weather Cagliari in November
Sea: 19 °
| 13 d/month | 7 d/month | 7 d/month | 2 d/month | 1 day |
In November, in Cagliari, temperatures range from 10 to 19 degrees. Rainfall in November: 71 inches, for about 22 days without rain.
Check the weather over the last 5 years for the dates of your stay
Weather history day by day
Weather Cagliari in December
Sea: 17 °
| 14 d/month | 10 d/month | 4 d/month | 1 day | 1 day | 1 day |
In December, in Cagliari, temperatures range from 7 to 15 degrees. The average rainfall is around 52 inches, 26 days without rain in December
Check the weather over the last 5 years for the dates of your stay
Weather history day by day
Temperature and climate in:
Aglientu | Alghero | Bosa | Cagliari | Caprera | Orgosolo | Oristano | Orosei | Provincia di Olbia-Tempio | Villasimius |