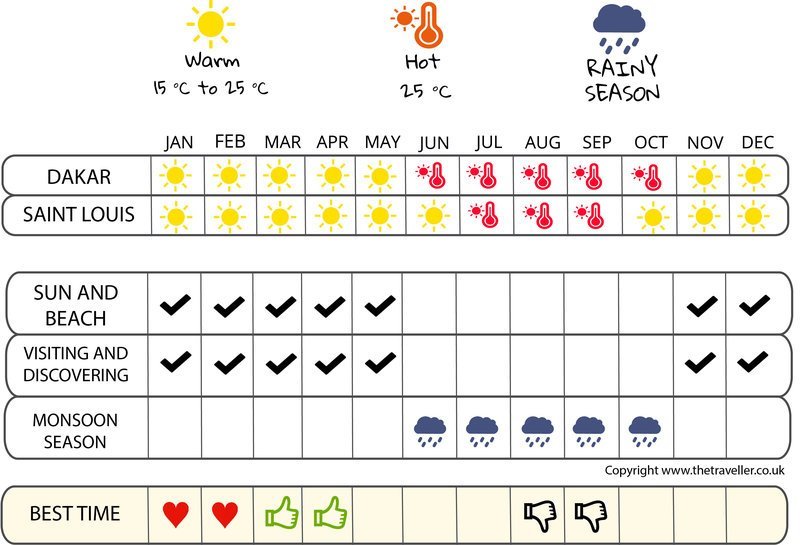
When to go to Senegal?

Senegal experiences climatic variation according to the region, but in general, the climate is mild. The temperature in the west of the country, which is bordered by the Atlantic Ocean, is cooler than elsewhere. Central and southern Senegal have a continental climate of warm days and cool nights. In the north and east, a tropical climate dominates. In general, during your trip to Senegal , you can expect two seasons: A dry season from November to May and a rainy season from June to October. It is worth knowing that the rains last longer in the south of the country. The dry season (before February) is the ideal time to visit Senegal as temperatures are mild (around 25°C). But a visit in wet weather, when flowers are blooming and birds are ubiquitous, can be rewarding despite the heat.
Below you will find all the climatic information to know when to go to Senegal.
|
Temperatures Dakar
| Jan | Feb | March | April | May | June | Jul | August | Sept | Oct | nov. | dec. | |
|---|---|---|---|---|---|---|---|---|---|---|---|---|
| Min temperature | 18° | 18° | 18° | 19° | 21° | 23° | 25° | 25° | 25° | 25° | 23° | 21° |
| Max temperature | 26° | 26° | 26° | 25° | 26° | 29° | 30° | 30° | 31° | 31° | 30° | 28° |
| Sea temperature | 23° | 21° | 20° | 21° | 23° | 26° | 28° | 28° | 29° | 29° | 27° | 25° |
Sunshine
Rainfall Dakar

The weather month by month in Senegal
Weather Dakar in January
Sea: 23 °
| 27 d/month | 4 d/month |
In January, in Dakar, Minimum temperatures vary between 18 in the morning and 26 in the afternoon. Temperatures are hot. The average rainfall is around 20 inches, for 31 days without rain.
Check the weather over the last 5 years for the dates of your stay
Weather history day by day
Weather Dakar in February
Sea: 21 °
| 23 d/month | 4 d/month | 1 day |
In February, in Dakar, Minimum temperatures vary between 18 in the morning and 26 in the afternoon. Temperatures are hot. The average rainfall is around 0 inches, for 31 days without rain.
Check the weather over the last 5 years for the dates of your stay
Weather history day by day
Weather Dakar in March
Sea: 20 °
| 29 d/month | 1 day | 1 day |
In March, in Dakar, Minimum temperatures vary between 18 in the morning and 26 in the afternoon. Temperatures are hot. The average rainfall is around 5 inches, for 31 days without rain.
Check the weather over the last 5 years for the dates of your stay
Weather history day by day
Weather Dakar in April
Sea: 21 °
| 29 d/month | 1 day |
In April, in Dakar, Minimum temperatures vary between 19 in the morning and 25 in the afternoon. The average rainfall is around 2 inches, for 31 days without rain.
Check the weather over the last 5 years for the dates of your stay
Weather history day by day
Weather Dakar in May
Sea: 23 °
| 29 d/month | 2 d/month |
In May, in Dakar, Minimum temperatures vary between 21 in the morning and 26 in the afternoon. Temperatures are hot. The average rainfall is around 0 inches, for 31 days without rain.
Check the weather over the last 5 years for the dates of your stay
Weather history day by day
Weather Dakar in June
Sea: 26 °
| 26 d/month | 2 d/month | 1 day | 1 day |
In June, in Dakar, Minimum temperatures vary between 23 in the morning and 29 in the afternoon. Temperatures are hot. The average rainfall is around 8 inches, for 30 days without rain.
Check the weather over the last 5 years for the dates of your stay
Weather history day by day
Weather Dakar in July
Sea: 28 °
| 16 d/month | 7 d/month | 3 d/month | 3 d/month | 1 day | 1 day |
In July, in Dakar, Minimum temperatures vary between 25 in the morning and 30 in the afternoon. The average rainfall is around 44 inches, for 27 days without rain.
Check the weather over the last 5 years for the dates of your stay
Weather history day by day
Weather Dakar in August
Sea: 28 °
| 10 d/month | 6 d/month | 6 d/month | 5 d/month | 3 d/month | 1 day |
In August, in Dakar, Minimum temperatures vary between 25 in the morning and 30 in the afternoon. The average rainfall is around 183 inches, for 20 days without rain.
Check the weather over the last 5 years for the dates of your stay
Weather history day by day
Weather Dakar in September
Sea: 29 °
| 13 d/month | 7 d/month | 5 d/month | 3 d/month | 2 d/month |
In September, in Dakar, Minimum temperatures vary between 25 in the morning and 31 in the afternoon. Températures are really hot. The average rainfall is around 142 inches, for 23 days without rain.
Check the weather over the last 5 years for the dates of your stay
Weather history day by day
Weather Dakar in October
Sea: 29 °
| 24 d/month | 3 d/month | 2 d/month | 1 day | 1 day |
In October, in Dakar, Minimum temperatures vary between 25 in the morning and 31 in the afternoon. Températures are really hot. The average rainfall is around 26 inches, for 28 days without rain.
Check the weather over the last 5 years for the dates of your stay
Weather history day by day
Weather Dakar in November
Sea: 27 °
| 22 d/month | 6 d/month | 1 day | 1 day |
In November, in Dakar, Minimum temperatures vary between 23 in the morning and 30 in the afternoon. The average rainfall is around 0 inches, for 30 days without rain.
Check the weather over the last 5 years for the dates of your stay
Weather history day by day
Weather Dakar in December
Sea: 25 °
| 24 d/month | 6 d/month | 1 day |
In December, in Dakar, Minimum temperatures vary between 21 in the morning and 28 in the afternoon. Temperatures are hot. The average rainfall is around 4 inches, for 31 days without rain.
Check the weather over the last 5 years for the dates of your stay
Weather history day by day
Temperature and climate in:
Almadi Point | Dakar | Kayar | Mbour | Ngor | Nguidjlone | Podor | Richard-Toll | Saint-Louis | Touba | Yoff | Ziguinchor |