When to go to Mauritius?
The Mauritian tropical climate experiences two seasons: the hot and humid austral summer between November and April, with temperatures that can exceed 30°C, and the austral winter between May and October which is milder and dry.
The climate in Mauritius is pleasant all year round. The austral summer is very hot and humid with violent rains. Although rare, cyclones can occur at this time of the year. Why not spend a family Christmas in Mauritius? If you are looking for cooler temperatures and drier weather, plan your trip between May and October. Temperatures are more bearable and vary between 17°C and 25°C. Surfers prefer June to August to take advantage of the trade winds.
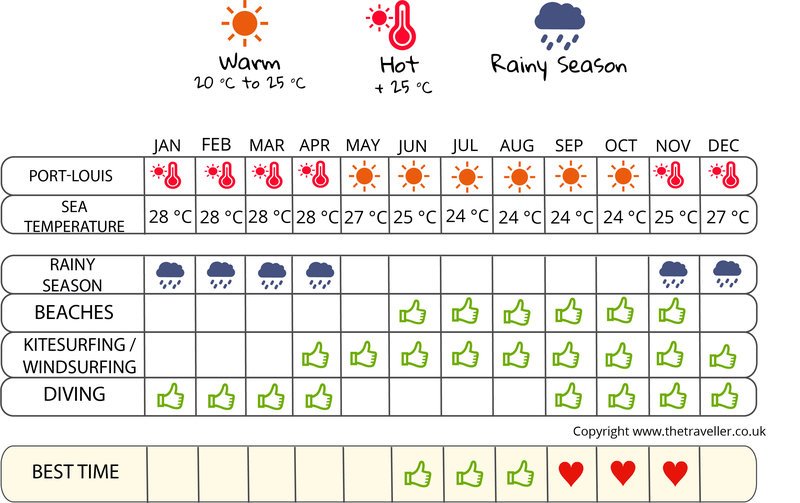
Although the island Mauritius can be visited all year long, we recommend the months of June to November to most enjoy the island’s idyllic beaches. Temperatures are pleasant and the rains infrequent.
|
Temperatures Mauritius
| Jan | Feb | March | April | May | June | Jul | August | Sept | Oct | nov. | dec. | |
|---|---|---|---|---|---|---|---|---|---|---|---|---|
| Min temperature | 21° | 21° | 21° | 20° | 18° | 16° | 16° | 16° | 16° | 17° | 18° | 20° |
| Max temperature | 28° | 28° | 27° | 26° | 25° | 23° | 22° | 22° | 23° | 24° | 26° | 27° |
| Sea temperature | 28° | 28° | 28° | 28° | 27° | 25° | 24° | 24° | 24° | 24° | 25° | 27° |
Sunshine
Rainfall Mauritius

The weather month by month in Mauritius
Weather Mauritius in January
Sea: 28 °
| 15 d/month | 7 d/month | 5 d/month | 4 d/month |
In January, in Mauritius, Minimum temperatures vary between 21 in the morning and 28 in the afternoon. Temperatures are hot. The average rainfall is around 259 inches, for 11 days without rain.
Check the weather over the last 5 years for the dates of your stay
Weather history day by day
Weather Mauritius in February
Sea: 28 °
| 13 d/month | 8 d/month | 4 d/month | 3 d/month |
In February, in Mauritius, Minimum temperatures vary between 21 in the morning and 28 in the afternoon. Temperatures are hot. The average rainfall is around 314 inches, for 10 days without rain.
Check the weather over the last 5 years for the dates of your stay
Weather history day by day
Weather Mauritius in March
Sea: 28 °
| 18 d/month | 5 d/month | 4 d/month | 4 d/month |
In March, in Mauritius, Minimum temperatures vary between 21 in the morning and 27 in the afternoon. Temperatures are hot. The average rainfall is around 296 inches, for 9 days without rain.
Check the weather over the last 5 years for the dates of your stay
Weather history day by day
Weather Mauritius in April
Sea: 28 °
| 14 d/month | 7 d/month | 6 d/month | 2 d/month | 1 day |
In April, in Mauritius, Minimum temperatures vary between 20 in the morning and 26 in the afternoon. Temperatures are hot. The average rainfall is around 160 inches, for 15 days without rain.
Check the weather over the last 5 years for the dates of your stay
Weather history day by day
Weather Mauritius in May
Sea: 27 °
| 15 d/month | 9 d/month | 7 d/month |
In May, in Mauritius, Minimum temperatures vary between 18 in the morning and 25 in the afternoon. The average rainfall is around 124 inches, for 16 days without rain.
Check the weather over the last 5 years for the dates of your stay
Weather history day by day
Weather Mauritius in June
Sea: 25 °
| 13 d/month | 9 d/month | 8 d/month |
In June, in Mauritius, Minimum temperatures vary between 16 in the morning and 23 in the afternoon. The average rainfall is around 85 inches, for 18 days without rain.
Check the weather over the last 5 years for the dates of your stay
Weather history day by day
Weather Mauritius in July
Sea: 24 °
| 11 d/month | 10 d/month | 7 d/month | 2 d/month | 1 day |
In July, in Mauritius, Minimum temperatures vary between 16 in the morning and 22 in the afternoon. The average rainfall is around 115 inches, for 19 days without rain.
Check the weather over the last 5 years for the dates of your stay
Weather history day by day
Weather Mauritius in August
Sea: 24 °
| 14 d/month | 9 d/month | 6 d/month | 1 day | 1 day |
In August, in Mauritius, Minimum temperatures vary between 16 in the morning and 22 in the afternoon. The average rainfall is around 100 inches, for 16 days without rain.
Check the weather over the last 5 years for the dates of your stay
Weather history day by day
Weather Mauritius in September
Sea: 24 °
| 11 d/month | 9 d/month | 8 d/month | 1 day | 1 day |
In September, in Mauritius, Minimum temperatures vary between 16 in the morning and 23 in the afternoon. The average rainfall is around 89 inches, for 22 days without rain.
Check the weather over the last 5 years for the dates of your stay
Weather history day by day
Weather Mauritius in October
Sea: 24 °
| 11 d/month | 9 d/month | 7 d/month | 3 d/month | 1 day |
In October, in Mauritius, Minimum temperatures vary between 17 in the morning and 24 in the afternoon. The average rainfall is around 51 inches, for 23 days without rain.
Check the weather over the last 5 years for the dates of your stay
Weather history day by day
Weather Mauritius in November
Sea: 25 °
| 11 d/month | 8 d/month | 8 d/month | 2 d/month | 1 day |
In November, in Mauritius, Minimum temperatures vary between 18 in the morning and 26 in the afternoon. Temperatures are hot. The average rainfall is around 48 inches, for 18 days without rain.
Check the weather over the last 5 years for the dates of your stay
Weather history day by day
Weather Mauritius in December
Sea: 27 °
| 14 d/month | 8 d/month | 6 d/month | 3 d/month |
In December, in Mauritius, Minimum temperatures vary between 20 in the morning and 27 in the afternoon. Temperatures are hot. The average rainfall is around 120 inches, for 14 days without rain.
Check the weather over the last 5 years for the dates of your stay
Weather history day by day
Influx of tourists
Temperature and climate in:
Anse La Raie | Belle Mare | Cap Malheureux | Central Flacq | Chamarel | Flic en Flac | Hermitage Island | Le Morne Bradant | Mahébourg | Port Louis | Quatre Bornes | Rodrigues Island | Saint Martin | Souillac | Tamarin | Triolet | Trou aux Biches |