When to go to Mexico?
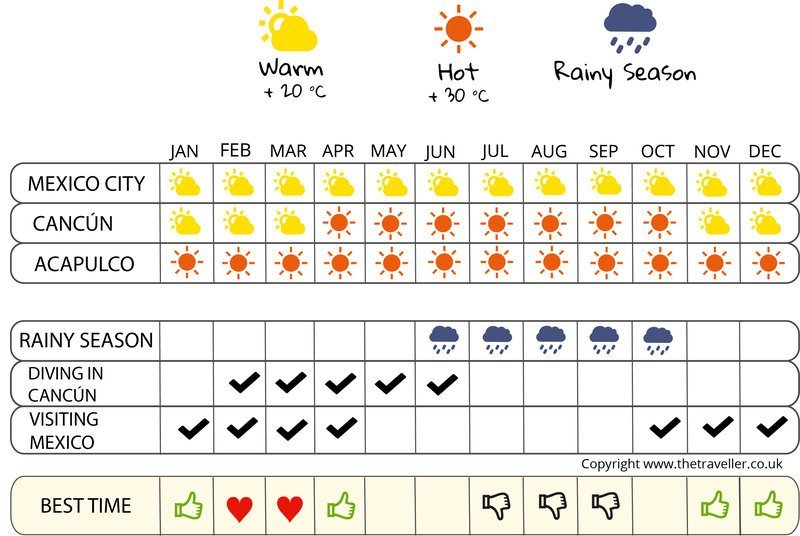
When should you go to Mexico? The months from October to April are the best months for your trip to Mexico as the days during this time are sunny and warm with an average temperature of 25┬░C.
Mexico is divided into two distinct weather zones by the Tropic of Cancer. The climate also varies depending on the altitude but overall the country basks in a hot and humid climate all year, especially in the south of the tropic, whereas the summits are subject to a temperate and dry climate with very cool winters. In the part of the country to the north of the tropic, the temperatures are very high in summer ŌĆō being able to reach 35┬░C, and cold in winter, especially at altitude. There is little rain, except during the summer months when violent thunderstorms can break out. In the part of the country to the south of the tropic ŌĆō the region most popular with tourists as MexicoŌĆÖs main archaeological sites can be found there ŌĆō the climate is characterised by two seasons : a dry season and a wet season. The dry season, which stretches from the months of November to May, is characterised by warm and mild temperatures with an average of 25┬░C and virtually non-existent rainfall. It is the ideal time to go and make your trip to Mexico . Between June and September, itŌĆÖs the rain season, characterised by higher temperatures at 30┬░C, and rain which can be quite heavy, falling towards the end of the afternoon and lasting for hours. Travelling around can prove difficult. We would therefore not recommend you choose this season to go to Mexico. The months of September and October are to be avoided in particular because of the cyclones which can hit the Mexican coasts.
In order to go and visit Mexico, we therefore recommend the months from October to April, the season during which temperatures are warm and rain does not occur frequently.
|
Temperatures Mexico City
| Jan | Feb | March | April | May | June | Jul | August | Sept | Oct | nov. | dec. | |
|---|---|---|---|---|---|---|---|---|---|---|---|---|
| Min temperature | 6┬░ | 8┬░ | 9┬░ | 12┬░ | 13┬░ | 14┬░ | 13┬░ | 13┬░ | 13┬░ | 11┬░ | 8┬░ | 6┬░ |
| Max temperature | 22┬░ | 24┬░ | 26┬░ | 27┬░ | 27┬░ | 25┬░ | 24┬░ | 24┬░ | 23┬░ | 23┬░ | 22┬░ | 22┬░ |
Sunshine
Rainfall Mexico City

The weather month by month in Mexico
Weather Mexico City in January
Sea: 0 ┬░
| 24 d/month | 3 d/month | 2 d/month | 1 day | 1 day |
In January, in Mexico City, temperatures range from 6 to 22 degrees. Temperatures are low but with a lot of sunshine. The average rainfall is around 31 inches, 30 days without rain in January
Check the weather over the last 5 years for the dates of your stay
Weather history day by day
Weather Mexico City in February
Sea: 0 ┬░
| 21 d/month | 2 d/month | 2 d/month | 1 day | 1 day | 1 day |
In February, in Mexico City, Minimum temperatures vary between 8 in the morning and 24 in the afternoon. The average rainfall is around 5 inches, for 29 days without rain.
Check the weather over the last 5 years for the dates of your stay
Weather history day by day
Weather Mexico City in March
Sea: 0 ┬░
| 26 d/month | 2 d/month | 2 d/month | 1 day |
In March, in Mexico City, temperatures range from 9 to 26 degrees. Temperatures are hot. Rainfall in March: 55 inches, for about 29 days without rain.
Check the weather over the last 5 years for the dates of your stay
Weather history day by day
Weather Mexico City in April
Sea: 0 ┬░
| 25 d/month | 2 d/month | 1 day | 1 day | 1 day |
In April, in Mexico City, l'amplitude des temp├®ratures varient de 12 ├Ā 27 ┬░ dans la journ├®e. Temperatures are hot. The average rainfall is around 69 inches, for 29 days without rain.
Check the weather over the last 5 years for the dates of your stay
Weather history day by day
Weather Mexico City in May
Sea: 0 ┬░
| 25 d/month | 3 d/month | 1 day | 1 day | 1 day |
In May, in Mexico City, Minimum temperatures vary between 13 in the morning and 27 in the afternoon. Temperatures are hot. The average rainfall is around 62 inches, for 27 days without rain.
Check the weather over the last 5 years for the dates of your stay
Weather history day by day
Weather Mexico City in June
Sea: 0 ┬░
| 20 d/month | 5 d/month | 2 d/month | 2 d/month | 1 day |
In June, in Mexico City, les temp├®ratures moyennes le matin sont de %s et de %s ┬░ l'apr├©s midi. The average rainfall is around 343 inches, for 24 days without rain.
Check the weather over the last 5 years for the dates of your stay
Weather history day by day
Weather Mexico City in July
Sea: 0 ┬░
| 16 d/month | 8 d/month | 4 d/month | 3 d/month |
In July, in Mexico City, Minimum temperatures vary between 13 in the morning and 24 in the afternoon. The average rainfall is around 193 inches, for 19 days without rain.
Check the weather over the last 5 years for the dates of your stay
Weather history day by day
Weather Mexico City in August
Sea: 0 ┬░
| 16 d/month | 6 d/month | 3 d/month | 3 d/month | 2 d/month | 1 day |
In August, in Mexico City, Minimum temperatures vary between 13 in the morning and 24 in the afternoon. The average rainfall is around 224 inches, for 23 days without rain.
Check the weather over the last 5 years for the dates of your stay
Weather history day by day
Weather Mexico City in September
Sea: 0 ┬░
| 14 d/month | 7 d/month | 3 d/month | 3 d/month | 2 d/month | 1 day |
In September, in Mexico City, Minimum temperatures vary between 13 in the morning and 23 in the afternoon. The average rainfall is around 309 inches, for 22 days without rain.
Check the weather over the last 5 years for the dates of your stay
Weather history day by day
Weather Mexico City in October
Sea: 0 ┬░
| 17 d/month | 6 d/month | 3 d/month | 3 d/month | 2 d/month |
In October, in Mexico City, Minimum temperatures vary between 11 in the morning and 23 in the afternoon. The average rainfall is around 179 inches, for 28 days without rain.
Check the weather over the last 5 years for the dates of your stay
Weather history day by day
Weather Mexico City in November
Sea: 0 ┬░
| 18 d/month | 5 d/month | 4 d/month | 1 day | 1 day | 1 day |
In November, in Mexico City, Minimum temperatures vary between 8 in the morning and 22 in the afternoon. The average rainfall is around 56 inches, for 29 days without rain.
Check the weather over the last 5 years for the dates of your stay
Weather history day by day
Weather Mexico City in December
Sea: 0 ┬░
| 22 d/month | 3 d/month | 3 d/month | 1 day | 1 day | 1 day |
In December, in Mexico City, temperatures range from 6 to 22 degrees. Temperatures are low but with a lot of sunshine. The average rainfall is around 0 inches, 29 days without rain in December
Check the weather over the last 5 years for the dates of your stay
Weather history day by day
Influx of tourists
Temperature and climate in:
Acapulco de Ju├Īrez | Camar├│n de Tejeda | Campeche | Canc├║n | Chichen Itza | Chihuahua City | Guadalajara | Guanajuato | Isla Mujeres | La Paz | Lagos de Moreno | M├®rida | Mexico City | Monterrey | Oaxaca | P├Ītzcuaro | Playa del Carmen | Puerto Escondido | Riviera Maya | San Miguel de Cozumel | Taxco | Tulum | Tuxtla Guti├®rrez | Zacatecas | Zipolite |